Why is wave climate important?
When scientists and non-scientists alike hear the word “climate,” often what springs to mind are concepts relating to the atmosphere: air temperature, greenhouse gases, wind, rain, storms, etc. In fact, the Intergovernmental Panel on Climate Change states that, “Climate in a narrow sense is usually defined as the ‘average weather’ … [which is defined more rigorously and most often by] surface variables such as temperature, precipitation, and wind” (IPCC 2013). So much focus is placed on quantities like temperature, precipitation, and wind, because those quantities have a pronounced impact on the daily lives of most people around the globe.
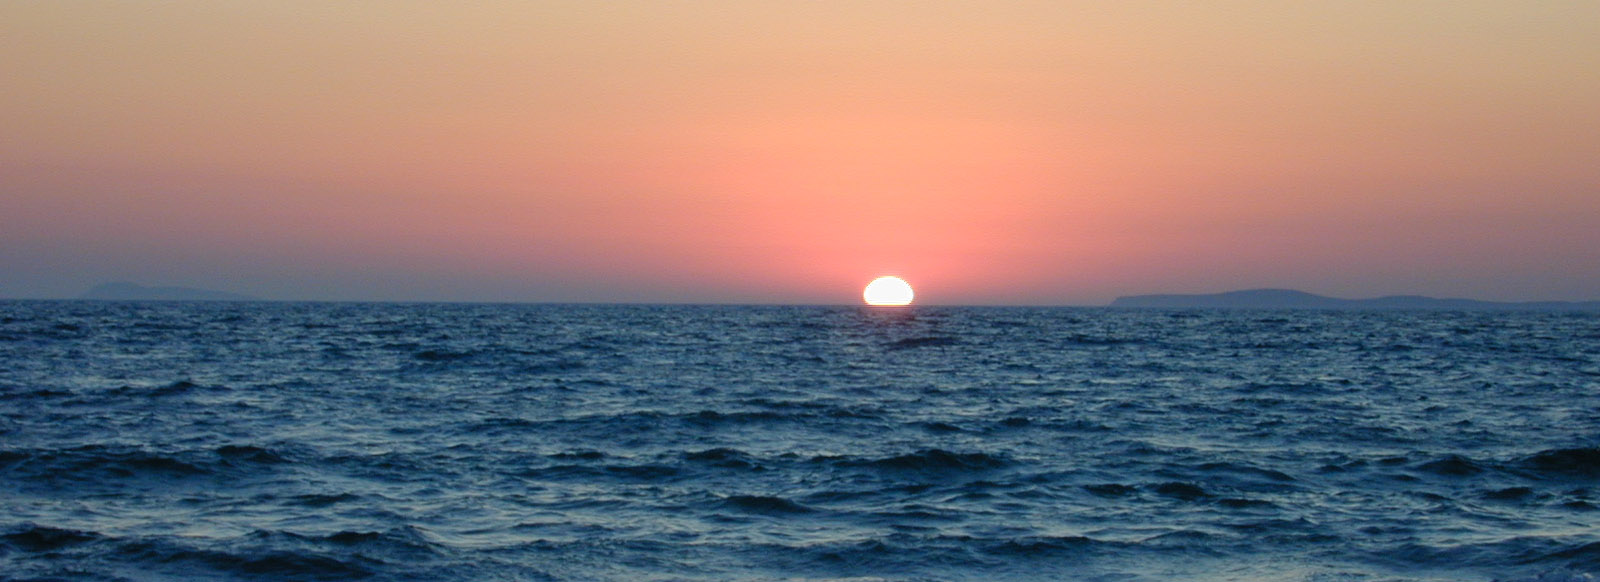
However, many people are unaware of one aspect of climate that can have immense significance for the living conditions and livelihoods of people living along the coast. Wave climate is the distribution of wave characteristics averaged over a period of time and for a particular location, just as atmospheric climate is defined as “average weather” for a given location and time. Nearly 10% of the global population lives within 20 km of the coastline and less than 20 meters above sea-level (Kummu et al. 2016). For these folks, wave climate can impact their daily lives as much as atmospheric weather. Large waves can disrupt harbor traffic and make boating dangerous, keeping fishermen and ferries docked while their businesses suffer. Large waves that break on the shoreline generate wave run-up, a temporary surge of water that rushes up the beach. This run-up can cause coastal flooding, erode beaches and cliff faces, and contaminate freshwater reservoirs, disrupting access to potable water and potentially damaging agriculture. For example, during Hurricane Sandy, waves removed sand from the front of beaches on barrier islands and dumped the sand on houses and roads behind the beach.
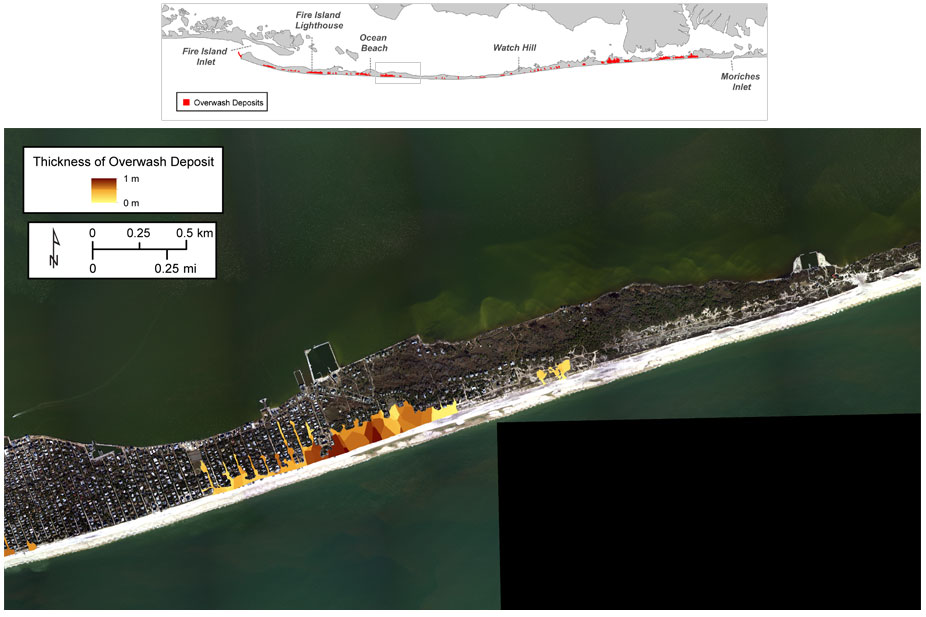
USGS map of sand overwash deposits on Fire Island, NY after Hurricane Sandy.
Much of the flooding in Manhattan high-rises during Hurricane Sandy was due to waves overtopping flood barriers. Storm surge and rainwater alone were not enough to flood the buildings, but the waves were (FEMA 2013). 97% of the damage in buildings severely damaged by Hurricane Sandy in New York and New Jersey was from waves and storm surge, as opposed to flooding from torrential rain (FEMA 2013). Destruction wreaked by waves during short storm events can be devastatingly costly, contributing significantly to the greater than $60 billion in estimated damages from Hurricane Sandy (FEMA 2013).
Most surface ocean waves are generated by wind blowing across the ocean surface, and large waves are usually generated by storms. Though many of these large waves are generated local storms, some waves generated by distant storms can travel a quarter of the way around the globe and still have a strong impact. The larger waves capable of major damage are usually less common than smaller, less destructive waves, but their frequency is a source of worry for those living along the coastline, just as large storms or natural disasters are for people living further inland.

USGS animated time series of Landsat satellite images showing annual fluctuations and decadal extension of a spit near Chatham on Cape Cod, Massachusetts. These changes to the shoreline are driven by longshore currents, which at this particular section of coastline are directed primarily to the south.
However, even small waves can affect people along the coastline, especially over a long time. Waves that aren’t perfectly perpendicular to the shoreline when they break induce a longshore current – a current that flows along the shoreline and can carry sediment. These longshore currents take sediment from one region of the shoreline and then deposit it further along the shore, leading to erosion in one area and buildup in another. The strength and direction of these currents depend on the nature of the waves.
Where wave characteristics change a lot over a year or decade, shorelines can fluctuate dramatically. For example, the sand under a coastal road could be swept off and transported to a distant beach one year, causing the road to collapse. But if the angle of the waves changes enough the next year, the same sand could be returned, burying the repaired road. While wave variability can alter the shoreline immensely over just a few years, average wave quality often takes decades to change more permanently, as with atmospheric climate change. These changes are longer-lasting than the year-to-year fluctuations of the coastal road example, and thus can have long-term implications for where people can live and make a living.
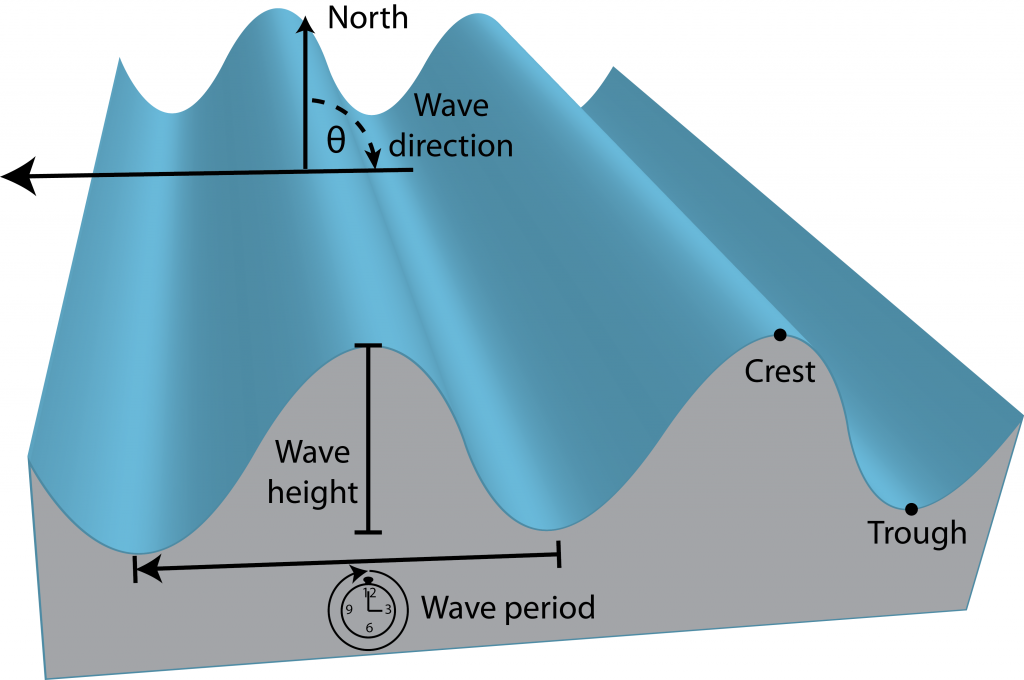
Schematic of a progressive ocean surface wave train.
Waves can be described with three different characteristics: wave height, wave period, and wave direction. Wave height is the vertical distance between the lowest point (trough) on a wave and the highest (crest). The larger the wave height, the more dangerous the conditions for boats and the more energy the wave has to construct or erode beaches and coastal cliffs. Wave period is the amount of time it takes for an entire wave, crest-to-crest, to travel past a point in space. All else equal, longer period waves can cause greater and more prolonged flooding. Wave direction is the direction from which a wave approaches an observer.
In practice, it is difficult to measure these variables because waves with different periods, heights, and directions can mix and produce very confusing wave patterns. Scientists and engineers use complex statistics to untangle wave components and produce three common summary statistics: significant wave height (Hs), peak wave period (Tp), and mean wave direction (θm). These three statistics are then used to describe wave climate, just as temperature, precipitation, and wind speed and direction might be used to describe atmospheric climate for a location.
Due to the importance of waves in so many people’s lives, scientists have constructed models to predict specific waves a week in advance and more general wave climate 50-100 years in advance (Shope et al. 2016). Short-term forecasts predicting wave characteristics over several days are popular among surfers hoping to catch big, reliable waves and fisherman or small boat users hoping to avoid dangerous conditions. To forecast average wave characteristics 50-100 years in the future, scientists have taken wind forecasts from atmospheric climate models and applied them to wave generation models. These long-term forecasts of average wave characteristics can then be used by governments to prepare for changing waves in a changing climate.
Hindcast of significant wave height in the Pacific Ocean in January, 1988 generated by the model Wavewatch III, using input from CFSR reanalysis data. The large red blobs moving west to east in the Northern and Southern hemispheres are extra-tropical cyclones. On January 7, one can see the formation of Category 4 Typhoon Roy and its landfalls in the Philippines and China. The cyan-colored waves in the central tropical Pacific and appearing to move west are waves driven by the trade winds.
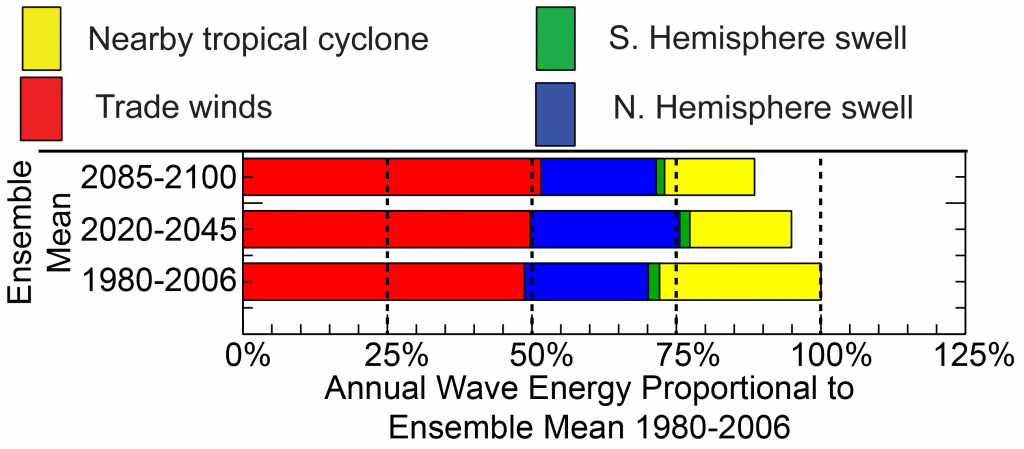
Annual wave energy as a percent of mean annual wave energy during 1980-2006. Wave energy modeled from generalized circulation model (GCM) output for RCP8.5. The data are from an ensemble mean of 4 GCMs from Coupled Model Intercomparison Project 5 (CMIP5). Note the forecast reduction in northern and southern hemisphere swell from extratropical cyclones as well as from nearby tropical cyclones. However, the GCMs used have difficulty accurately modeling tropical cyclones, and downscaled models actually show an increase in tropical cyclone frequency and magnitude in the western North Pacific.
As an example, examining wave model hindcasts (like forecasts, but for the past to fill in gaps in field data) shows that there are four main sources of waves in the western tropical Pacific Ocean: (1) Swell (long period waves that travel a long way) from high-latitude northern hemisphere storms (2) Swell from high-latitude southern hemisphere storms (3) Locally-generated large waves from tropical cyclones that are created and grow in the tropics, and (4) Locally-generated waves from the trade winds that blow east to west across the Pacific. At Kwajalein Island, which is only several meters above sea-level at its highest point and is home to an American army base, these four sources of waves are forecast to change over the next 100 years. If humans fail to curtail greenhouse gas concentrations (i.e. as under the IPCC representative concentration pathway 8.5 scenario, RCP8.5, IPCC 2013), Kwajalein Island will likely see smaller swell from both northern and southern hemisphere storms. If it weren’t for sea-level rise, this would be good news for the island, which is at risk of flooding from large, long-period waves. But with projected sea-level rise in this scenario exceeding 0.6 m by 2100 (from the year 2000), this island will likely experience more frequent flooding events by the end of the century.
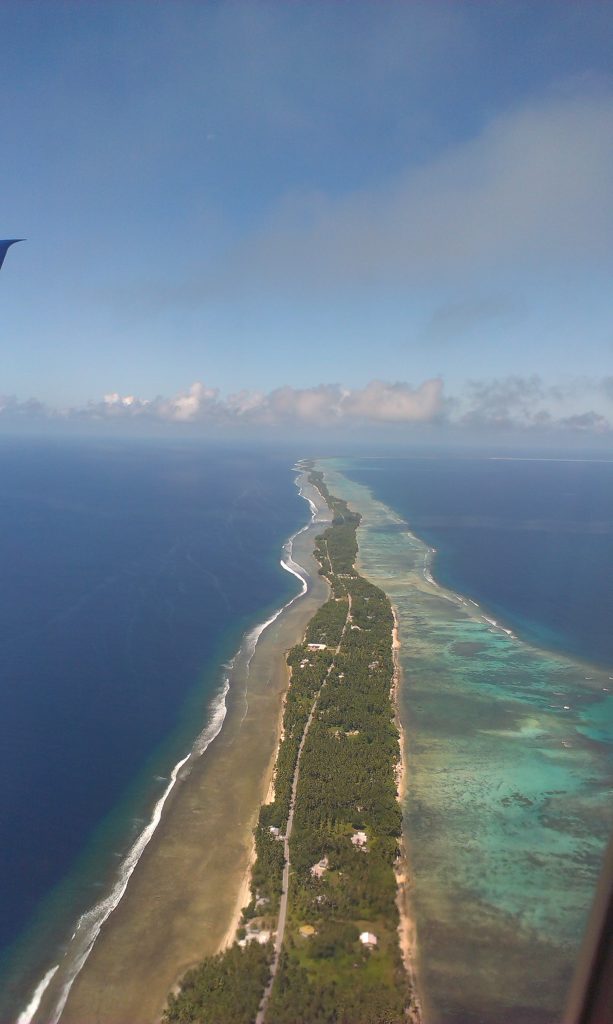
Photo of Majuro, the capital city/atoll of the Marshall Islands, taken from an airplane window. All of the land is very close to sea level, as on most atoll islands.
Due to shifts in average wave direction, even if island shorelines keep up with sea-level rise, they will likely look very different in 100 years. If waves change direction, longshore currents will also change, either becoming stronger or weaker and potentially reversing direction. Alteration of longshore currents can drive rapid change in coastlines made of unconsolidated sediments (coastlines consisting of sand or mud, not rocky outcrops). For example, the USGS just published a study looking at the affect changing wave climate will have on Wake and Midway Atolls in the Hawaiian Island chain (Shope et al. 2017). They predict that shifts in wave direction, driven both by sea-level rise and wave climate changes, will result in thinning of islands, where sediment is eroded from the long edges of the islands and deposited at the ends or carried away altogether. Similar patterns of erosion may become commonplace throughout the Pacific, driving people living in the Marshall Islands, the Maldives, and elsewhere off their ancestral lands.
Although wave climate often gets short shrift in popular conceptions about climate change, for some it has enormous repercussions.
References
FEMA. (2013). Hurricane Sandy in New Jersey and New York: Building performance observations, recommendations, and technical guidance. Federal Emergency Management Administration Mitigation Assessment Team Report, FEMA P-942.
IPCC. (2013). Climate Change 2013: The Physical Science Basis. Contribution of Working Group I to the Fifth Assessment Report of the Intergovernmental Panel on Climate Change. [Stocker, T.F., D. Qin, G.-K. Plattner, M. Tignor, S.K. Allen, J. Boschung, A. Nauels, Y. Xia, V. Bex and P.M. Midgley (eds.)]. Cambridge University Press, Cambridge, United Kingdom and New York, NY, USA, 1535 pp, doi:10.1017/CBO9781107415324.
Kummu, M., de Moel, H., Salvucci, G., Viviroli, D., Ward, P.J., and Varis, O. (2016). “Over the hills and further away from coast: Global geospatial patterns of human and environment over the 20-21st centuries.” Environmental Research Letters 11: 034010.
Shope, J.B., Storlazzi, C.D., Erikson, L.H., and Hegermiller, C.A. (2016). “Changes to extreme wave climates of islands within the Western Tropical Pacific throughout the 21st century under RCP 4.5 and RCP 8.5, with implications for island vulnerability and sustainability.” Global and Planetary Change 141: 25-38.
Shope, J.B., Storlazzi, C.D., and Hoeke, R.K. (2017). “Projected atoll shoreline and run-up changes in response to sea-level rise and varying large wave conditions at Wake and Midway Atolls, Northwestern Hawaiian Islands.” Geomorphology 295: 537-550.