A brief history of the Wide Receiver Functions
Back in 2015, when my cousin set up a fantasy football league for my extended family, I named my first (and only) fantasy football team the “Wide Receiver Functions.” At the time I thought this was rather funny, but I was the only seismologist in the league, so instead of laughter I got confusion. Wide receiver…functions? What functions? I can’t offer much of an explanation of the “wide receiver” part (they’re the ones who catch the football, right?), but here, long past due, is a primer on receiver functions for the curious non-seismologist.
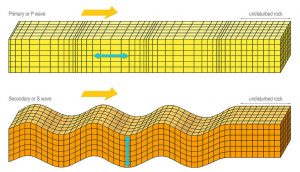
P and S wave illustration. The yellow arrows point in the direction of wave propagation, and the blue arrows show the direction of material motion for P waves (top) and S waves (bottom). (Gary Hincks/sciencesource.com)
When an earthquake happens, it releases energy. That energy travels through the Earth as various kinds of waves, including P and S waves. P (primary) waves travel fast, and their direction of propagation is the same as the direction of material motion: you can imagine them as moving kind of like an earthworm, squishing together and then stretching out along the direction of motion. S (secondary) waves travel slower than P waves, and are more like the wave you see when you flick the end of a rope, with the material moving perpendicular to the direction of wave propagation. When energy from a distant earthquake makes its way up to the Earth’s surface, the wave propagation direction is usually close to vertical, so a seismometer recording energy from a distant quake mostly picks up P waves as vertical motion and S waves as horizontal motion.
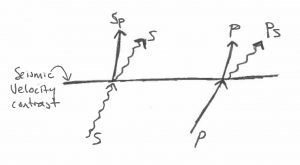
S waves hitting an abrupt change in seismic velocity can convert to P waves (called Sp); likewise, P waves can convert to S waves (called Ps).
As those P and S waves travel through the Earth, they may well encounter a large, abrupt change in physical properties—a change in the composition of the mantle, say, or a change in melt content, or a mineral phase transition—and that change causes some wave energy to convert from P to S or S to P. Starting with a P wave on one side of a contrast, you’ll get a P wave and a weak S wave, which we call Ps, on the other side; an S wave incident on a contrast will give you an S and a weak P known as Sp. The initial wave and its converted partner then continue on their merry ways.

In the seismology olympics, P waves win all the races (sorry, S waves).
Since P waves travel faster than S waves, the initial and converted waves will reach us at our seismometer (aka our receiver) at different times. We can use the time difference between the direct P or S and its converted counterpart to estimate the depth at which the conversion happened, based on what we know about P and S wave velocities.
Receiver functions are how we measure that time difference. Converted waves are usually not very energetic, so they’re hard to see in seismic data. The receiver function method is a way of ferreting out those converted phases using a technique called deconvolution.
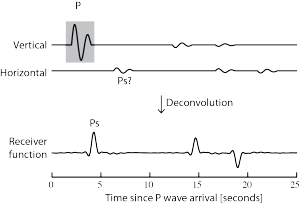
The top two traces are example records of P and S wave data, which can be used to calculate the receiver function shown at the bottom. With this perfect (noise-free) example data, converted waves show up easily. Figure modified from Shearer (2008).
Intuitively, you can think of deconvolution as a matching process. We know the shape of the initial wave, and we want to find its converted partner—for example, say we’re using an initial P wave to look for converted S waves. We take the P wave from the vertical motion measured by our seismometer, and compare its shape to the seismometer’s record of horizontal motion to try and find similar-looking bits of S waves. Say the P wave is about 10 seconds long: line it up with the first 10 seconds of the horizontal record. How similar do they look? If they look very similar, the receiver function value there is large and positive; if they look similar but with opposite sign, large and negative; or if they look very different, then the value is near zero. Now slide the P wave over a little in time and compare it to another 10 second section of the horizontal record. Keep sliding that P wave along the whole record, and voila! You’ve got your receiver function.
In a receiver function, converted phases should show up as positive or negative peaks. The sign depends on the kind of contrast that caused the conversion, and those conversions happened more or less directly below our seismometer. The method doesn’t always work: if the data are too noisy, for example, we may not be able to see anything at all. But if the data are good, all sorts of structure can show up.
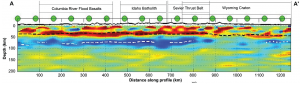
Receiver functions can help us find the base of the continental lithosphere! The blue band with the white dashes running through it is interpreted as the lithosphere-asthenosphere boundary beneath the Northwest US. Figure from Hopper et al. 2014.
Receiver functions have been used to map out upper mantle structure in many places. These functions can help us image the 410 and 660 discontinuities, which are associated with mineral phase changes in the upper mantle; they can reveal the lower boundaries of tectonic plates; and they have illuminated a feature known as the mid-lithospheric discontinuity in some parts of the continents. In my research, I’m using receiver functions to try and image the bottom boundary of the Pacific plate using data from ocean-bottom seismometers.
In the end, the Wide Receiver Functions didn’t do very well in the fantasy football league—I think they came in last, or second to last, among the teams. I don’t really understand the game: they measure distances in yards, increment points in sevens, and when one player tackles another, they don’t even bifurcate into P and S players on the other side. And what’s getting converted in a 2-point conversion, anyway? But I know a lot more about seismology than I do about football, and hopefully my actual receiver function calculations will go better than the first and final season of the Wide Receiver Functions.