Underway Data
Summary
A standard Shipboard Meteorological System is installed on the USCGC Healy. The system measures air temperature, barometric pressure, wind speed/direction, relative humidity, short wave radiation, long wave radiation, seawater temperature and seawater conductivity. Sensor information is combined with time and GPS position information and recorded in daily data files. Shipboard wind and underway CTD data were used during the HLY1702 survey.
Shipboard Wind data
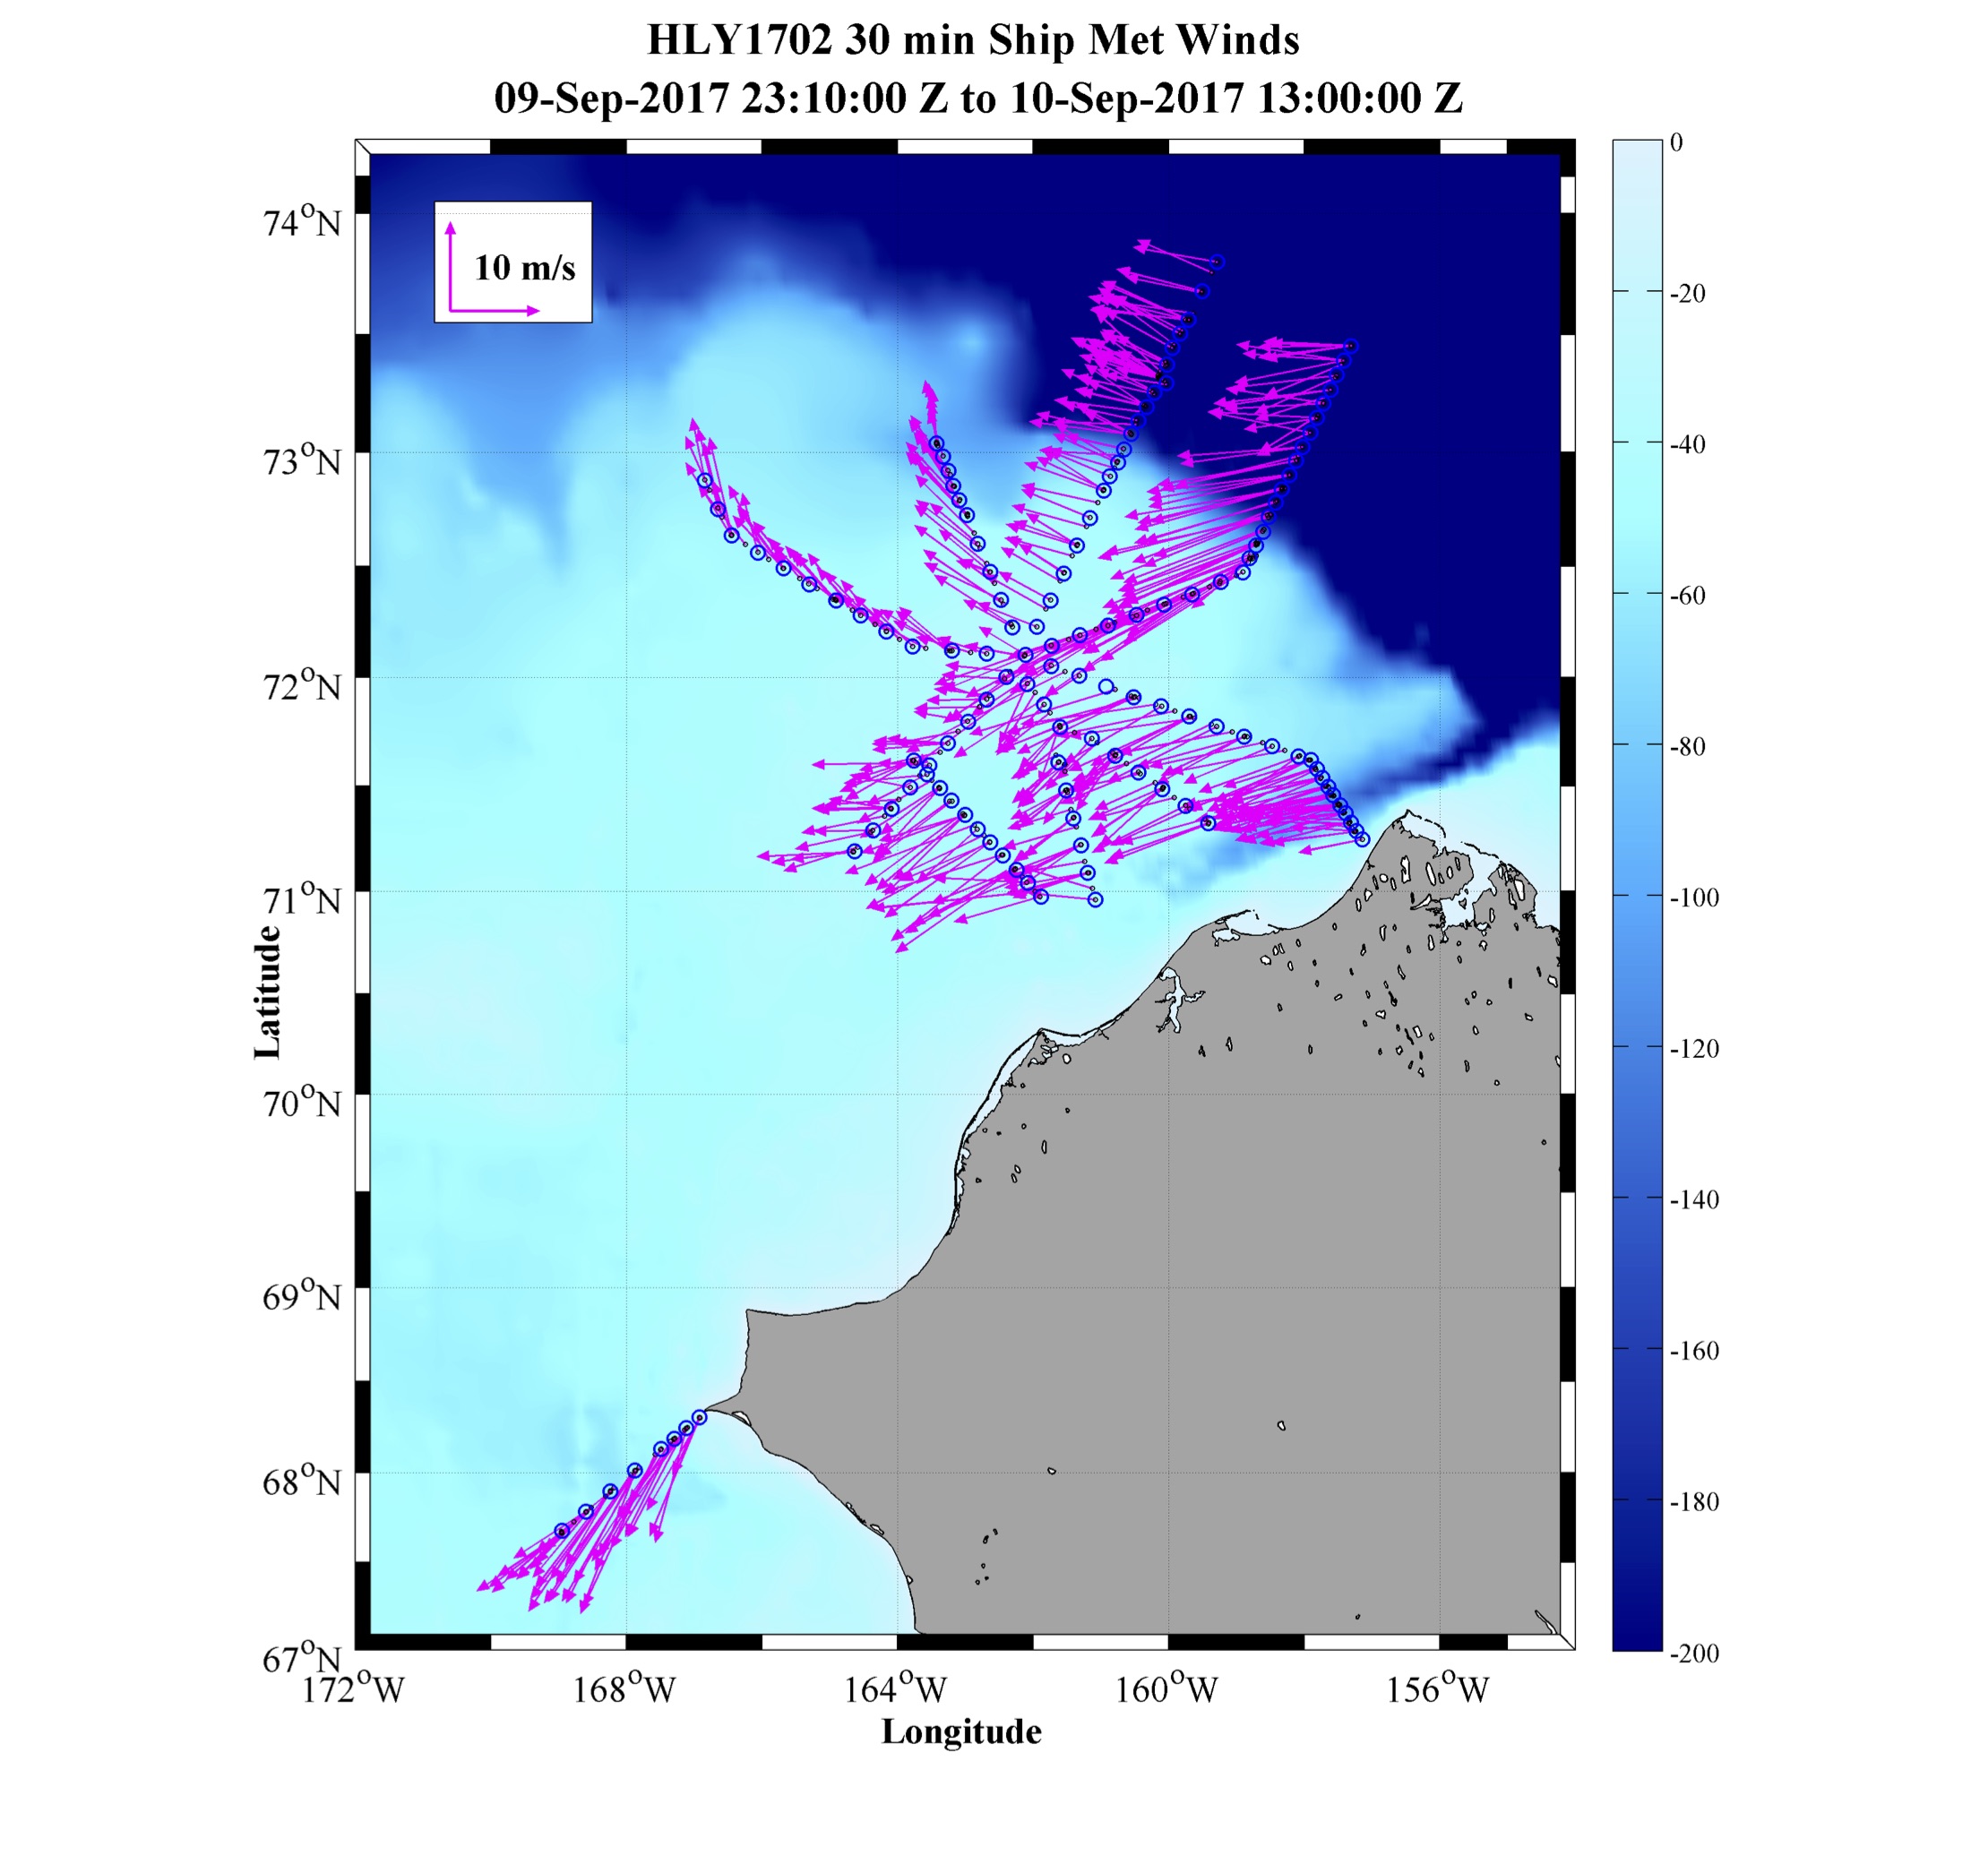
True wind speed/direction along survey sections north of the Bering Strait. Wind vectors show the direction that the wind is blowing towards.
The shipboard MET system recorded data from two sonic anemometers: one located on the bow jack staff, and one on the main mast yardarm above the bridge. Data files included ship speed/heading, relative wind speed/direction, and true wind speed/direction. By comparing data from both sonic anemometers with the ship speed/direction, it was determined that the anemometer located on the bow jack staff suffered from modified airflow around the structure of the ship, often resulting in anomalously low wind speed values and slow response to wind speed changes. As there were no other available recorded shipboard wind measurements, it was decided to use the anemometer located on the main mast yardarm for the entire HLY1702 survey. The figure to the left shows the true wind speed/direction along the survey sections north of Bering Strait.
Underway CTD data
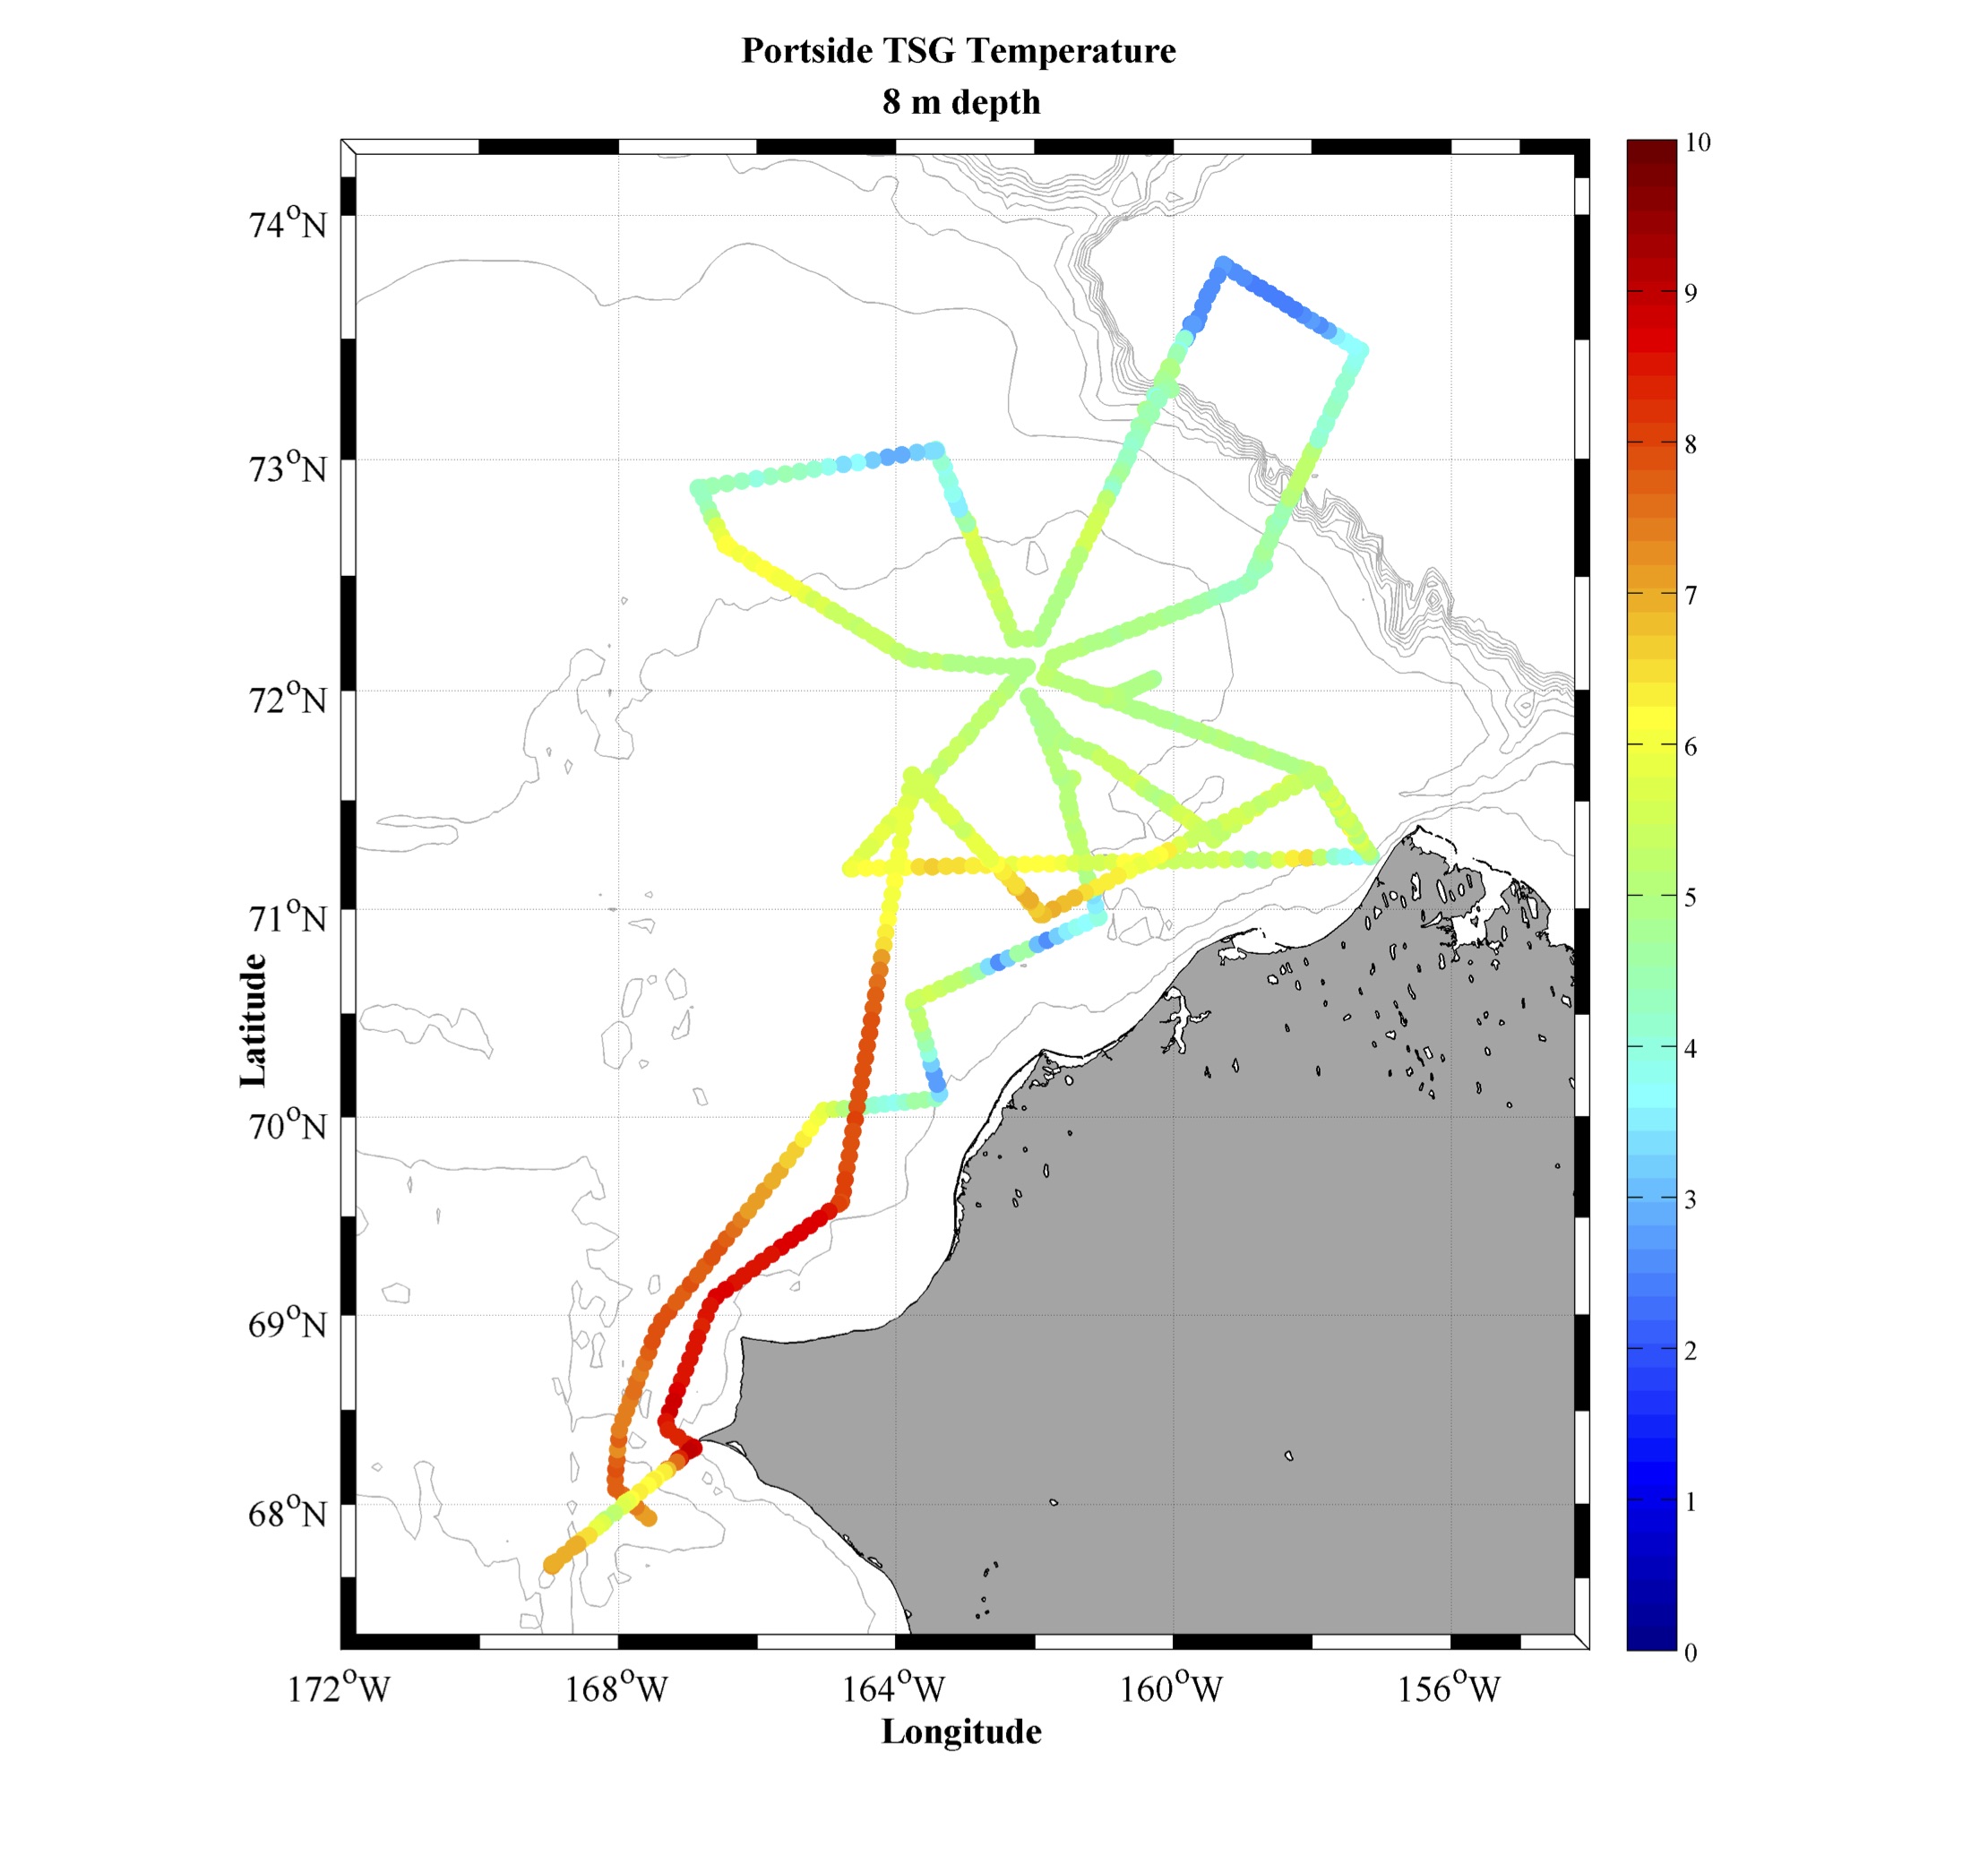
Ocean temperature at 8 m depth along the HLY1702 cruise track north of Bering Strait (oC, color).
The shipboard MET system recorded ocean temperature and salinity through a water intake located at 8 m depth on the bow of the ship. A Seabird Electronics sensor measured water temperature close to the seawater intake. Farther down the seawater intake line an SBE21 Thermosalinograph (TSG) measured conductivity and temperature. Throughout the cruise, the TSG temperature consistently measured ~0.5 °C warmer than the Seabird temperature sensor closer to the bow intake. Since there was such a large discrepancy in available temperature readings, the TSG temperature was used (despite being anomalously warm) to be consistent with the TSG conductivity. The figure to the left shows the TSG temperature along the HLY1702 cruise track north of Bering Strait
Data Download
