
For the past several days, we have been making our way over an underwater mountain chain called the Mid-Atlantic Ridge, or MAR for short. This ridge, which snakes its way southward from Iceland through the North and South Atlantic, results from the spreading of two tectonic plates and the bubbling up of molten rock to form new sea floor. Of course this is happening at a snail’s pace—the two plates are separating at a rate of only 2.5 centimeters per year on average.

: This schematic diagram shows the general pattern of deep and shallow currents in our study area. (The deep currents are colored light blue to purple, the shallow currents are red to dark yellow.) Note how many (although not all) of the currents seem to follow the shape of the sea floor, which is indicated by gray shading. In particular, the currents south of Iceland flow southwestward along the flank of the Reykjanes Ridge (the northern part of the Mid-Atlantic Ridge) until they reach deep gaps or passes in the ridge such as the Charlie-Gibbs Fracture Zone (CGFZ). Most of the flow then turns westward and enters the western part of the North Atlantic. A small filament continues southward along the eastern side of the ridge. This illustrates the strong control that the shape of the sea floor has on deep ocean currents.
The height of the MAR—about 3,000 feet above the surrounding ocean bottom, is modest compared to, for example, the Rocky Mountains, which soar to 14,000 feet above sea level. Nonetheless, the MAR has a big impact on deep ocean currents. Because of the rotation of the earth, currents generally flow along hills rather than up and over them. As illustrated in the diagram below, deep currents flow parallel to the Reykjanes Ridge (the name for the northern part of the MAR) until they find a gap in the mountain chain called a fracture zone, such as the Charlie-Gibbs Fracture Zone (CGFZ). There the currents can cross to the other side of the MAR. This is sort of the equivalent of a mountain pass in the terrestrial world.
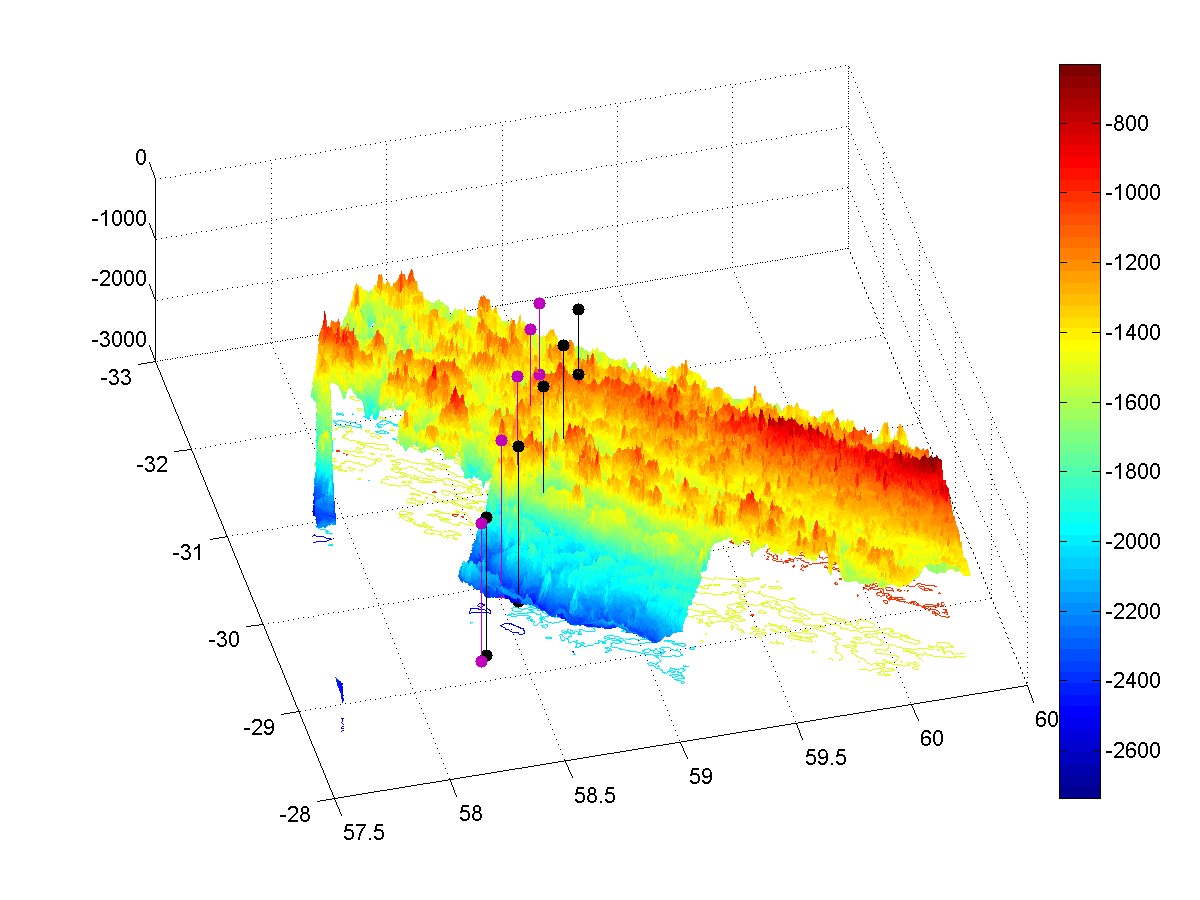
This 3D map of the sea floor (looking towards the southwest) shows the slope of the eastern flank of the Reykjanes Ridge (part of the Mid-Atlantic Ridge) from shallow (red shading) to deep (blue shading). Depth scale, in meters, is on the right hand side. The vertical lines with circles indicate some of the moorings we are deploying on this cruise. The sea floor data were collected by French geologists several years ago. We were able to use this pre-existing information to more quickly identify the right location for each mooring. We are also collecting sea floor depth data ourselves to fill in areas that the French survey doesn’t cover.
We need to be very aware of the details of the MAR before we put a mooring down. The MAR is a relatively new mountain range, and it is underwater, away from the erosional effects of wind, ice and rain. So its landscape is extremely rugged. Before we deploy a mooring, we have to survey the shape of the sea floor for several hours to find just the right spot. This is a slow-motion equivalent of flying an airplane over the Berkshires from an altitude of one mile and mapping the shape of the mountains just below the airplane. We do this by bouncing sound off the sea floor and measuring the round-trip travel time of the sound signal. As described in an earlier post, sound is used extensively in oceanography as both our eyes and ears. It can take several hours of “flying” over the intended mooringsite before we are satisfied that we know the “lay of the land” far below us. The second picture below shows an example of the shape of the sea floor in the region we have been working over the past few days. This data was actually collected by French geologists and it took many days to for a research vessel to cover this area, which is about 3,000 square miles.
 Amy Bower is a physical oceanographer at the Woods Hole Oceanographic Institution. She has been chasing ocean currents in the Atlantic and Indian Oceans for over 25 years, primarily by releasing acoustically tracked floats far below the sea surface. Legally blind since her mid-20s, Amy uses adaptive technology to continue her research.