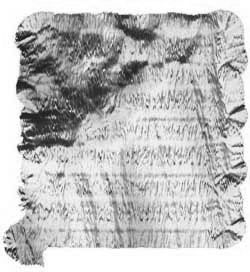
A low-resolution version of our high-resolution map of the seafloor where we want NUI to take a closer look. (image by the NUI engineering team)
Today (Thursday) was a day to pause and breathe.
I slept REALLY well last night, and today we headed back to the seafloor with the OFOS deep-tow camera system in search of our elusive deep-ocean vent site. While I was busy with that, the NUI engineering team were busy preparing the vehicle for its next dive, which I negotiated to occur on Friday 9/30 rather than Thursday, so that the team has time to add some new tricks to the vehicle’s capabilities.
In addition to sorting out the vehicle’s camera system and also working out how to improve our navigation system once the vehicle is submerged, Andrew and Mike also then had time to work up some of the data from the dive and generated a map of the seabed that we took a close look at.
Instead of a very general image of the seabed created by ship-based sensors, we now have an exquisitely sharp relief map of a region over which we towed the OFOS when we first arrived here. It helps explain why, in three of all the photographs we looked at, we saw bare rock while everywhere else was covered in giant sponges. It turns out there is a steep, 40-meter (130-foot) hill running through the area, and that steep slope defines one side of a roughly 150 meter (490 foot) gully running across and just below the summit. Sounds like a geological fault to me!
But wait, there’s more. As NUI was climbing the steepest part of the hill that we mapped on Tuesday’s dive, right at the end of the survey, it also recorded a redox anomaly on an Eh sensor supplied by our colleague Ko-ichi Nakamura. [Editor’s note: Eh is a measure of redox potential—essentially the likelihood that ions in a system or solution will exchange electrons and undergo reduction/oxidation reactions. It is also one of the signs that hydrothermal fluids are probably flowing into the ocean nearby.]
The anomaly only occurred once, but the signal was so clear compared to readings throughout the preceding six hours that it is hard to dismiss as an error. What makes it all the more alluring is that the reading appears to coincide with a steep-sided feature cutting through the seafloor. As I keep boring anybody here who will listen to me, if you want fluid to escape from the seafloor, you first need a pathway, like a fault. But then I also caution: Maps are seductive, don’t let lumps and bumps on the seabed get you over-excited. So here I am trying to walk that fine line between intrigue and calm.
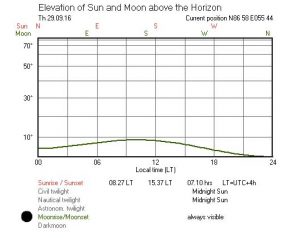
In other news, the sun went down yesterday and won’t be coming back until March at this location.
Of course, it was perhaps inevitable that the only place we saw the anomaly was right at the end of the survey. If there’s one thing I’ve learned over the past 12 years of exploring the ocean with AUVs, it seems the best stuff is ALWAYS stuck right in the corner. So now we are getting ready to do what seems most obvious. First, we will extend our mapping northwards along the same geologic feature to see where it goes and, by overlapping our chemical analysis with where we left off, to see whether we can find the same chemical anomaly in the overlying ocean. Second, we will drop down to the seafloor and photograph of some of the area that we mapped.
Who knows? It’s entirely possible that the science is going to work out just the way I envisioned in the proposal and we’ll find weird and subtle forms of chemically laden fluid flow at the top of Karasik fueling abundant biological activity in a way that only NUI could be expected to search out and find.
That sounds crazy-brilliant! Why didn’t I think of that? Oh, wait…