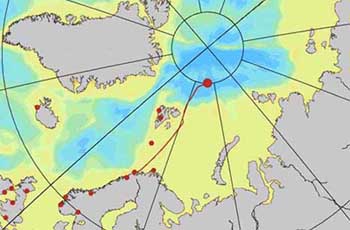
Our cruise track to date (noon, 9/14/16) is shown by the solid red line on the map at right. After leaving Tromso near 70°N last Friday we sailed all the way to 85°N and are now just 300 miles from the North Pole (the X in the center of the large circle). Home for the WHOI team is south and west of Greenland (left off the map) and the line running through 0° of Longitude passes through Greenwich (near London) in the bottom left corner. We came north at a longitude of about 30°E and when we reach the next solid line of longitude (60°E), it will be time to turn and head another 100 miles north to the ridge-axis and, hopefully, some really hot vent sites. We should be there in another two days or so.
The new ice is so thin (just a few centimeters) that we are speeding along at more than 6 knots, so our Chief Scientist Antje is very encouraged—the less time we spend getting to the work area, the more time we will work once we get there. Slowly but steadily, anticipation is building. Indeed, the only thing slowing us down on the NUI team right now is our collective cold.
It started with John and Louis, then hit Mike, our Expedition Leader, particularly hard, and how now progressed through Stefano and Casey to me. Jill and Kevin both work in separate labs from the rest of us, so they seem to have been protected. Young Andrew must be particularly resilient: he seems to be doing fine.
Everybody is working hard to get all of the instruments ready for arrival at the ridge axis, but we have also been enjoying a series of lectures each evening that help break up the monotony of breakfast-work-lunch-work-dinner-work-sleep. After Kevin’s talk on Sunday about the ice-covered ocean worlds of the solar system, Marcel Nicolaus brought us down to Earth on Monday, teaching us about the current state of Arctic sea ice and then last night it was my turn to draw people ever further in toward the center of the Earth in a talk about hydrothermal vents on the seafloor, what we might expect on this expedition, and how we will go about exploring for them.
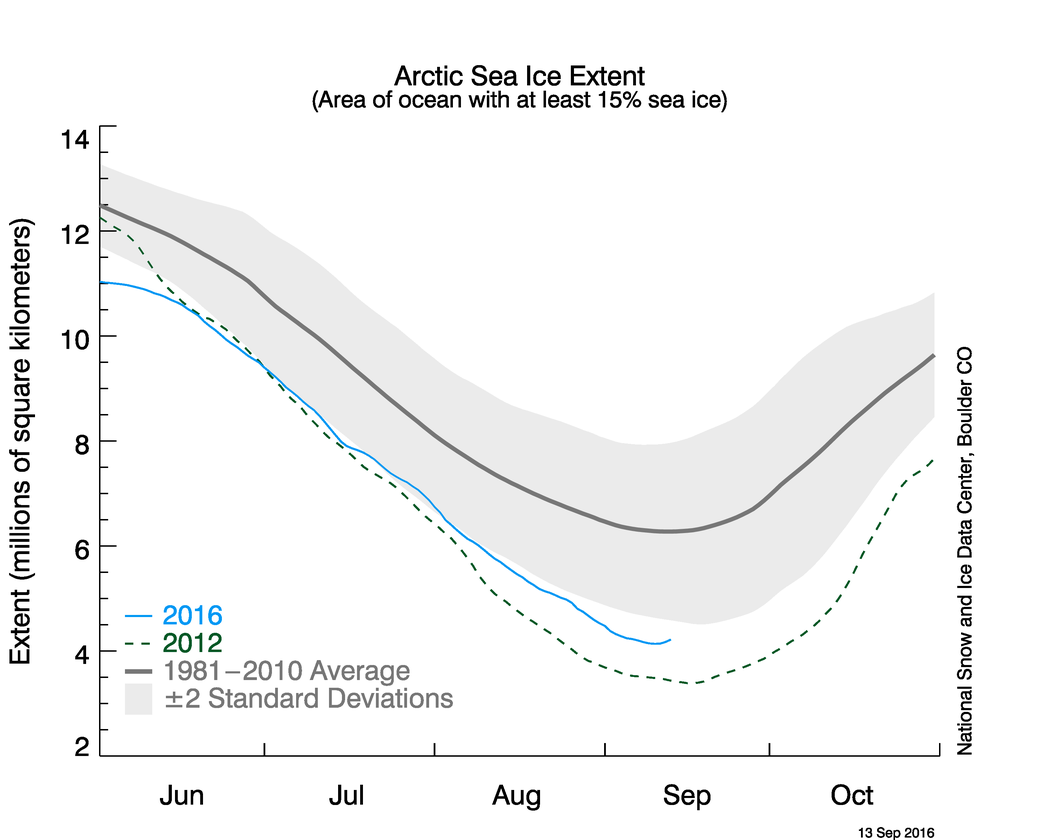
[Click to expand] A graph showing this year’s Arctic sea ice extent (blue line) compared to the record low year of 2012 (green) and the 1981-2010 average (gray). This year’s minimum (thus far) of 4.137 million km2 occurred on 9/10/16. (National Snow and Ice Data Center)
To help Marcel and his colleagues, we are all now signed up to spend time on the ship’s bridge each day to record ice conditions once every hour when there is enough daylight. My training for the job took place at 11:00 a.m. today and while I was being shown how to collect all the information we need, Marcel also pointed out a series of polar bear footprints in the ice that the ship was busy cutting through.
No sightings of actual polar bears yet, though. We’ll keep observing!