If you’re feeling like you’ve had enough of keeping an eye on instruments and making regular log entries for a bit while on watch, you’re in luck because whenever they are on (which is most of the time that Sentry isn’t in the water — its own acoustic communications would be hindered by the other sonars’ simultaneous operation), the TOPAS and multibeam are outputting megabytes upon megabytes of raw data which need to processed to correct for things like the unpredictable rolling of the Sikuliaq, noise from the bubbles from the ship’s drive, and other irregularities.
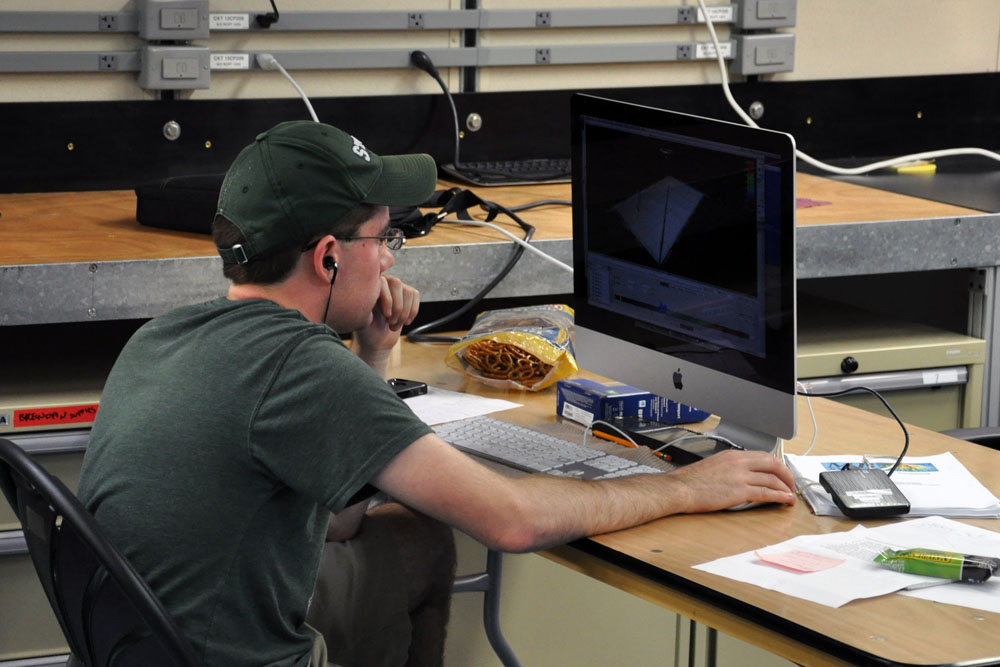
John, creating 3d topographic maps of the seafloor from multibeam data
Data processing takes place on the computers in the main lab, and consists of operating a few specialized software programs depending on the instrument of interest. Depth data from the multibeam echo-sounder is processed in several phases. Raw sonar timing data from the multibeam is courteously converted by the software driving the instrument to a series of depth profile “slices” tracing contours along the surface of the ocean floor. These slices appear as lines — cross sections of a portion of the bottom perpendicular to the direction of the ship’s travel.
In an ideal world, the ship would traverse a steady, straight course through still water with a completely known temperature profile, the drives would produce no bubbles or extraneous energy of any kind, and waves would be an imaginary abstraction. In the real world, the drives produce bubbles, the ship pitches (tilting forward and backward), rolls (tilting side-to-side), and heaves (bobbing up and down relative to the plane of the ocean’s surface), making even the most accurately calculated ping timings produce noisy, messy depth data that does not reflect the true shape of the bottom.
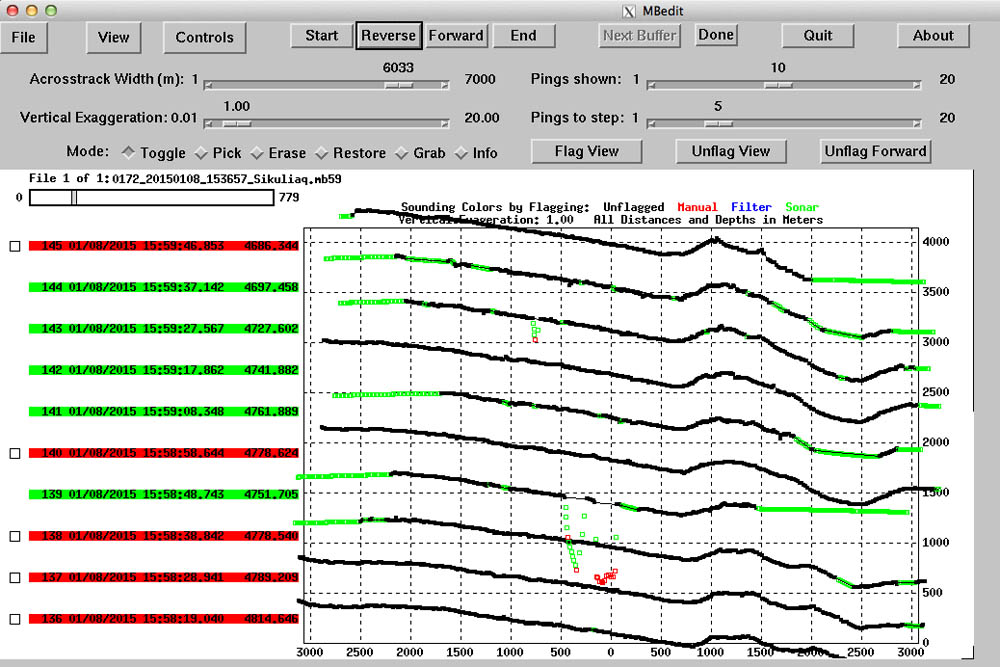
Editing interface for multibeam data. Each line is a swath showing the depth perpendicular to the ship’s course
It is a simple, if somewhat involved and time-consuming matter, to manually inspect each slice or beam swath for noticeably anomalous points and eliminate them, allowing the software to make mathematical interpolation of that particular depth reading rather than letting a noisy point contaminate the shape of the depth profile. In practice, this task consists of scrolling through screens of “waterfall” view sequences of slices and clicking on individual points or groups of points to flag them as anomalous.
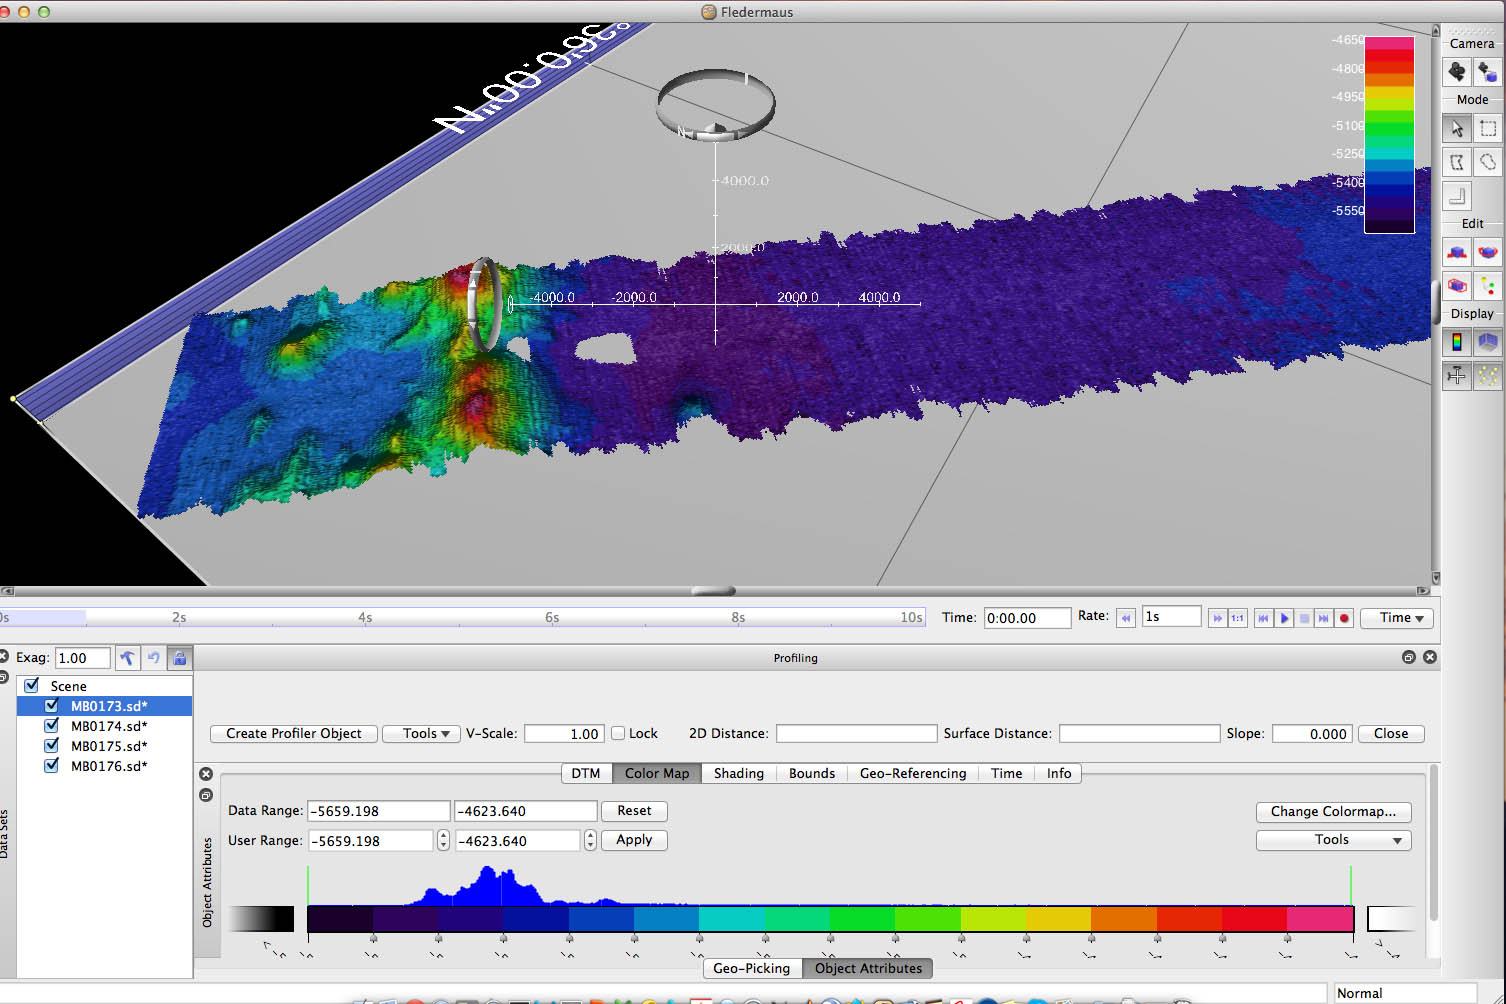
Multibeam data is combined and interpolated to create 3d depth maps in Fledermaus
The payoff for this work is a clean set of depth data for the day’s multibeam surveying that can be fed through another program to produce three dimensional topographic representations of the ocean floor. The student’s job at this step is simply to verify that all the segments of a survey fit together properly, and to edit the color gradient used to show variations in depth to maximize the visibility and contrast of the features of the bottom. In some cases, these will be the first 3D maps of a given section of ocean floor ever to be acquired.
***
The TOPAS parametric sub-bottom sonar also produces data that requires some supervision in order to maximize its utility. Being concerned with the sub-bottom density and structure, TOPAS is dealing with targets further away and therefore more difficult to analyze than the multibeam. Therefore, under identical circumstances, it’s usually safe to expect slightly less noisy data from the multibeam than the TOPAS. Fortunately, the TOPAS software provides a deep suite of signal processing tools to help the operator pick out the range from each frequency-modulated pulse most useful to the task at hand.
For a student watchstander, processing TOPAS data means: loading up a series of data files, running through the file at a slightly higher than realtime speed to get a feel for the peculiarities of this particular track, applying a matched filter (to ideally improve the signal-to-noise ratio) or passband filter (in the case of an overwhelming need to attenuate all non-interesting frequencies), adjusting the mute timing to ignore all echoes returning too early to have come from the bottom or sub-bottom, possibly tweaking the time-variable gain to emphasize echoes in a certain time range and hopefully therefore a well-known spatial range in the sub-bottom, and then having arrived at a satisfactory configuration, replaying the file in logging mode to produce a processed output file.
Because the sub-bottom profiler of this design is such a new instrument, and it is so rare to have one on a research vessel of this size, it’s an exciting privilege to be among the first to feel out the capabilities of this instrument in the deep-ocean environments of the JQZ.