Over twenty sailors covering a round-the-clock watchstanding schedule; a couple dozen scientists and engineers pulling fieldwork-level hours — making sure all these people have a variety of hearty healthy food available when they need it is the challenge facing, and admirably met by, the galley.
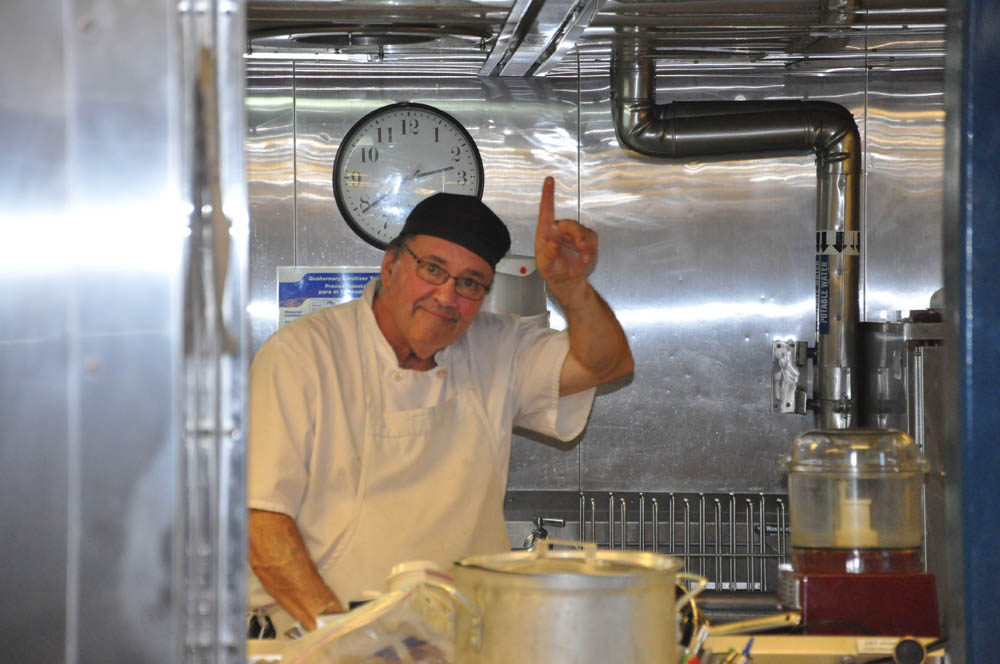
Chief steward Tony, in his element
Thanks to chief steward Matt for a generous overview of the role of the galley