Drought & Aridity
Hydrologic variability poses significant challenges to society. However, the potential for hydrologic change remains poorly understood. Sedimentary patterns within small lake basins record past changes in water levels and can be used to track shifts in moisture availability over time. This study assessed hydrologic variability at the scale of millennia and centuries over the past 11,000 years in Massachusetts, where lake sedimentary data indicate significant changes in the frequency of past droughts. The creation, analysis, and synthesis of new, well-resolved sedimentary data, in combination with detailed fossil pollen data, enabled us to evaluate sub-millennial hydrologic variability, its controls, and its effects.
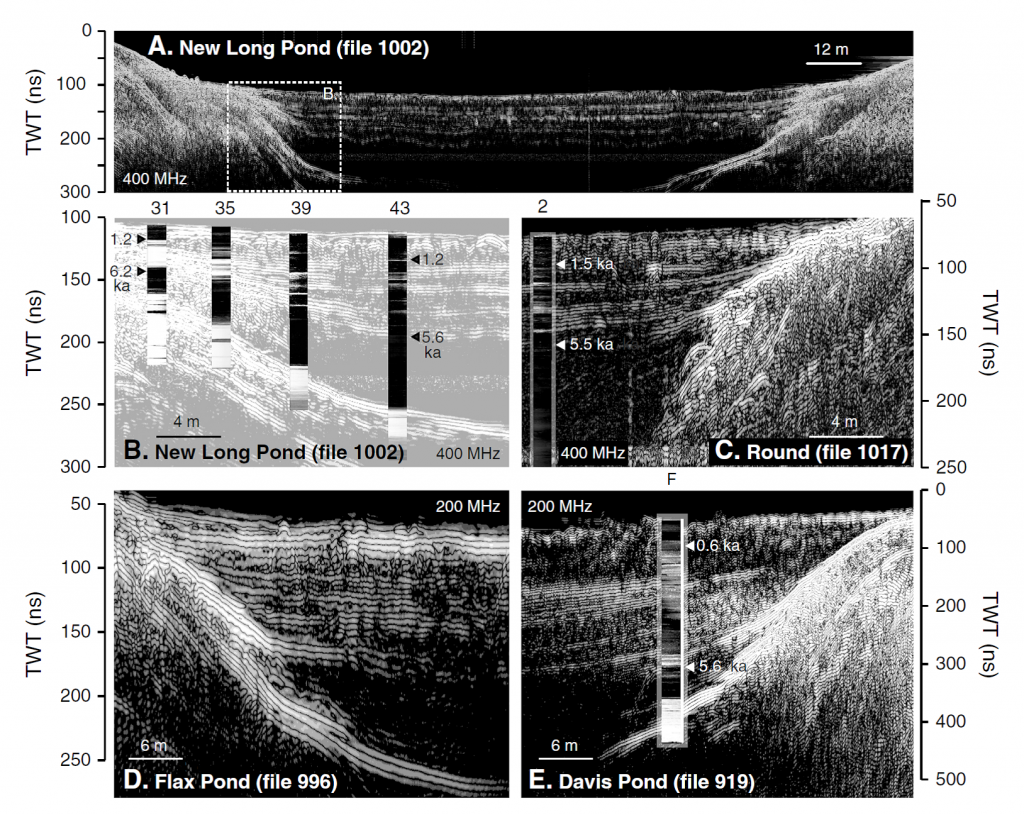
Geophysical and sedimentary records from five lakes in Massachusetts reveal regionally coherent hydrologic variability during the Holocene. All of the lakes have risen since ~9.0 ka, but multicentury droughts after 5.6 ka repeatedly lowered their water levels. Quantified water level histories from the three best-studied lakes share >70% of their reconstructed variance. Four prominent low-water phases at 4.9–4.6, 4.2–3.9, 2.9–2.1, and 1.3–1.2 ka were synchronous across coastal lakes, even after accounting for age uncertainties. The droughts also affected sites up to ~200 km inland, but water level changes at 5.6–4.9 ka appear out of phase between inland and coastal lakes. During the enhanced multicentury variability after ~5.6 ka, droughts coincided with cooling in Greenland and may indicate circulation changes across the North Atlantic region. Overall, the records demonstrate that current water levels are exceptionally high and confirm the sensitivity of water resources in the northeast U.S. to climate change.

